Microsoft Power BI Training
One of the top Microsoft Power BI Online Training institutes in Bangalore with highly skilled trainers
- 4.7


- 105 Google reviews
|
Class Availability
Weekdays & Weekends
|
Course Duration
40-45 Hours
|
Training Methodology
25% Theory & 75% Practical
|
Class Availability
Weekdays & Weekends
Course Duration
40-45 Hours
Training Methodology
25% Theory & 75% Practical
4970
Profesionals Trained
350
Workshops Every Month
50
Countries And Counting
100
Corporate Served Successfully
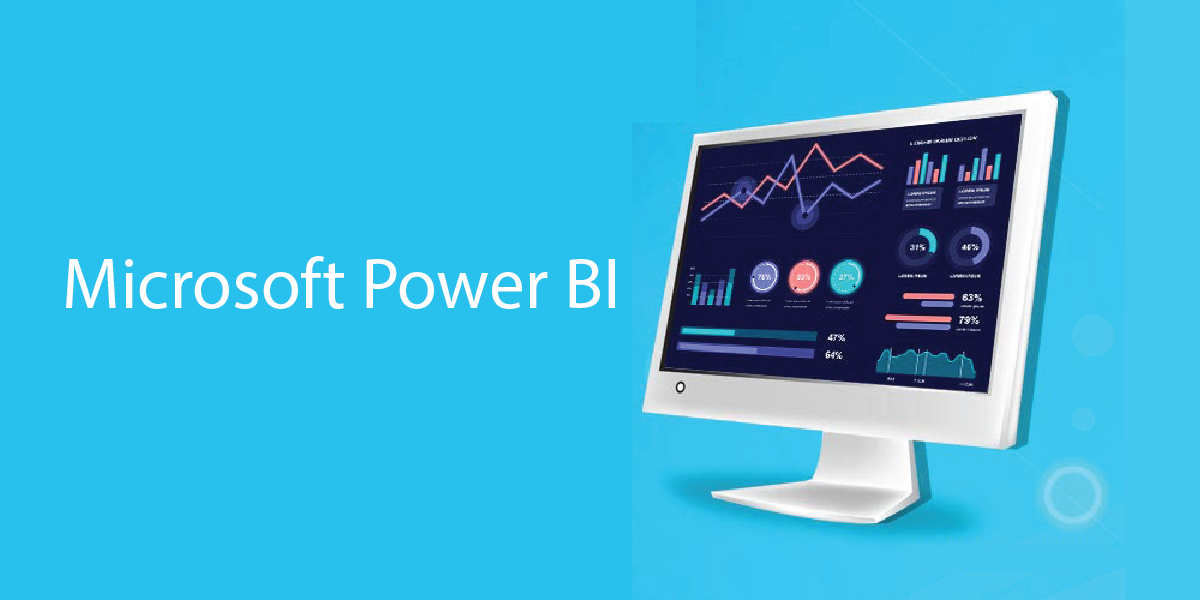
Want to learn how to analyze and visualize business data with Microsoft Bi? Get industry-best Microsoft Power BI Training at IQ Stream Technologies!
In the age of information, data is everything. The better you manage your data, the closer you get to achieving your goals. But just by storing large amounts of data, you won’t be able to make any sense of it. Therefore, it’s important that you store the data in a neatly arranged fashion so that it can be accessed, analysed, and used to drive deep insights about your performance. At the same time, find opportunities that may be hidden in the vast cluster of information.
But of-course manual methods of data analysis expressions are time-consuming and quite hectic. And that’s where Microsoft Power BI comes into picture.
Microsoft Power Bi
Microsoft Power Bi
Microsoft Power BI is a set of tools & applications that’s changing the way we used to analyse the data. Whether it’s an excel spreadsheet, a cloud-based storage or any other on-premises servers, Power BI lets you connect with all your data sources through one platform so that you can analyse and find useful information, and share it with anyone you like.
What is Microsoft Power
With power BI, you can arrange your data into a neatly stacked set of information with visually appealing insights, interactive data, charts, graphs and reports. This makes it easy to understand and make meaning out of the mountains of information which otherwise may not be of much use.
The three basic types of Power BI are:
- Microsoft Power BI Desktop for Windows desktop.
- Power BI Service is an online SaaS (Software as a Service) service.
- Power BI mobile Apps for Windows, iOS, and Android devices.
Apart from these basic elements, Power BI also features:
- Power BI Report Builder helps you create paginated reports to share in the Power BI service.
- Power BI Report Server is an on-premises server where you can publish your Power BI reports after creating them on Power BI Desktop.
Microsoft Power BI Desktop
Microsoft Power BI Desktop
Power BI Desktop is a free desktop application, also known as Power BI Free which works
cohesively with Power Bi service. It comes with all Microsoft Office 365 plans, and you can opt for
Power BI Free whenever you like.
Power BI Desktop allows you to cleanse, organize and export your data to excel. You can also
create as many visualisations as you like since it gives you complete access to Power BI’s library of
visualization templates.
Now since it’s a free service, there’s a limit to the total storage in Power BI cloud i.e. 10 GB. And
you can upload data reports of upto 1 GB at a time. You can save and publish your data & reports
right to your Power BI site so as to share it with others.
What is Microsoft Power BI?
What is Microsoft Power BI?
Microsoft Power BI is a cloud-based business intelligence platform that lets users (especially those
who’re not technically savvy) aggregate, analyse, visualise, export and share data with others. Its
intuitive design makes it a user-friendly and self-service tool that can be used by anyone.
Power BI connects with numerous data sources to access and analyse large amounts of data. It can
be used to give you deep insights about your business which can then be extracted into easy-to-
understand, visually appealing reports with graphs and charts etc.
The foundation of Microsoft Power BI is based on Microsoft Excel. Thus, anyone who is familiar
with Excel can use power BI with little to no upfront training. Power BI is an effective way to not
only understand the past and present but also to predict the future for opportunities and demand
of coming times.
Want to learn about Power BI? Waste no more time and enrol with IQ Stream Technologies today
and enhance your data collection and data analytics skills!
Microsoft Power Platform
Microsoft Power Platform
Microsoft Power Platform is a group of tools and services such as Power BI, PowerApps and
Microsoft Flow.
PowerApps can be used by organisations to create their own responsive business applications with
a single click without the need of coding knowledge or developers. It can be used by anyone to
build and launch fully functional apps without writing a single line of code.
Just like PowerApps, Microsoft Flow can be used to automate various tasks that are supposed to
be carried out on a regular basis and takes ample of time with traditional methods. These
automated workflows can be used to connect your Microsoft services to third-party apps and
programs without getting into all the complications of merging them otherwise.
Microsoft Power BI Tools
Microsoft Power BI Tools
The Microsoft Power BI tools are business intelligence (BI) apps and softwares that can be used to
extract and process large amounts of unstructured data from all kinds of sources, be it internal or
external. The data sources may include books, journals, documents, health records, images, files,
email, video, and other sources.
This suite of tools lets you create, publish and distribute your data reports across various channels,
as well as with other Microsoft products and services.
Every Power BI product has its own features and uses. Here’s a list of some common Power BI
tools that you’ll get your hands-on during this course:
1. Power Query is a data connection tool that lets you transform, merge and process data
from several sources.
2. Power Pivots is a data modelling tool.
3. Power View is a data visualization tool that helps you create interactive charts, graphs,
maps, and other appealing custom visuals.
4. Power Map is a 3D visualisation tool that lets you create stunning and immersive 3D
geospatial visuals.
5. Power Q & A is a question and answer engine that you can use to ask questions about your
data.
Microsoft Power BI Training
Microsoft Power BI Training
IQ Stream Technologies offer the best Microsoft Power BI training in Bangalore. Designed to create great data analysts, this course will enable you to use Microsoft Power BI with high efficiency. With our Power BI courses, you can enhance your technical skills especially data management and analysis, and increase your market value to kick-start your career with leading enterprises.
Power BI is one of the most demanding skills in the world today because of its applications and scope in various industries. IQ Stream tech provides all its trainees with real-time projects and hands-on experience of all the popular tools.
The key skills you’ll learn in this course include:
- Artificial Intelligence
- Hybrid Deployment
- Data Analysis
- Data Modelling
- Cortana Integration
- Customization & Visualization
- API (Application Performance Interfaces) for Integration
- Self-service Data Preparation
Contact us to get enrolled into our Power BI training courses, one of the most popular courses in
the world. Learn all the Power BI skills by our renowned industry experts for real-time knowledge
and take your career to new heights.
Microsoft Power BI Certification
Microsoft Power BI Certification
Our Microsoft Power BI certification course is made for everyone who works with data in any
sector. This course is suitable for data scientists, developers, analysts, project managers, and other
IT professionals, and not just business intelligence professionals.
Upon successful completion of our Microsoft Power BI Certification course, you’ll be provided with
an industry-recognized course completion certificate with lifetime validity. These skills once
learned will add a lot of value to your resume for real time career growth. A certificate like this can
also help you get the salary hikes you so desire.
The key features of our Microsoft Power BI training & certification include:
- Full hands-on training
- Expert faculty from the industry (active in their field)
- Comprehensive course materials
- Resume preparation
- Interview preparation
- 100% career oriented
- Affordable course fee
- One-on-one assistance
Microsoft Power BI Guided Learning
Microsoft Power BI Guided Learning
IQ Stream gives you real world exposure and experience through our easy methodology of guided learning. This well-structured guided learning is a great way to ensure that your learning never stops and your doubts may be resolved on the spot by like-minded peers.
Guided learning helps you follow the course through our articles, videos, tutorials and other course materials to accomplish common Power BI tasks on your own.
Microsoft Power BI Jobs
Microsoft Power BI Jobs
Data is an integral part of any business, be it IT or non-IT. The job responsibilities of a data analyst may vary from company to company. But in any case, the demand for BI professionals is on the rise. Some of the specific roles you may get into upon completion of Microsoft Power BI training are:
- Business Intelligence Architect
- Data Analyst
- Business Intelligence Developer
IQ Stream Technologies has helped 1000s of trainees get their dream job. We help all our sincere trainees to get into the desired industry with a significant salary package by enhancing their subject knowledge and interpersonal skills.
If you too want to take your career to the new heights, register with us today. For more details, contact us now.
POWER BI COURSE CONTENT
Power BI Complete Introduction
Power BI Complete Introduction
Power BI Introduction
Data Visualization, Reporting
Business Intelligence(BI), Traditional BI, Self-Serviced BI
Cloud Based BI, On Premise BI
Power BI Products
Power BI Desktop (Power Query, Power Pivot, Power View)
Flow of Work in Power BI Desktop
Power BI Service, Power BI Report Server, Power BI Mobile
Flow of Work in Power BI / Power BI Architecture
A Brief History of Power BI
Power BI Desktop Software Installation
Power BI Desktop Software Installation
How to Download Power BI Desktop Software
What are the Prerequisites to Install Power BI Desktop Software
Power BI Desktop Installation procedure
How to Open Power BI Desktop
Power Query Software Overview
Power Query Software Overview
Overview of Power Query / Power Query Editor
How to Open Power Query / Power Query Editor Software
Connecting to Data Sources and Extracting the Data
Establish connection to the Excel source
Establish connection to the SQL Server
Importing Data into Power Query Editor
Transforming the Data in Power Query Editor using GUI Options
Loading the Data into Power Pivot
Understanding the M(Mashup) Language behind the GUI Options
Power Pivot Software Overview
Power Pivot Software Overview
Understanding about Power Pivot – A In Memory Columnar Database
Advantage of In Memory Columnar Database
Power Pivot – xVelocity In-memory Analytics Engine (Previously called Vertipaq)
Overview of Data Modeling – Model View(Previously Relationship View)
Enhancing the Data Model – DAX(Data Analysis eXpressions) Language – Data
View
Power View Software Overview
Power View Software Overview
Overview of Visualizations, Fields, Field Wells
Understanding Dimension Columns & Fact Columns
Visualizing the Data using Power View and Power Maps – Report View
Saving Report
Publishing the Report to Power BI Service
Power BI Service Overview
Power BI Service Overview
Power BI Service Overview
Logon to Power BI Service
Share the Reports with Clients
Power BI Desktop User Interface
Power BI Desktop User Interface
Understanding Power BI Desktop User Interface
Fields Pane, Visualizations Pane, Filters Pane
Ribbon, Multiple Views (Report View, Data View & Model View)
Report Canvas, Pages Section
Building Blocks of Power BI
Building Blocks of Power BI
Datasets, Visualizations, Reports, Dashboards & Tiles
Power Query
Introduction to Power Query & Power Query Editor User Interface
Introduction to Power Query & Power Query Editor User Interface
Overview of Power Query / Query Editor
How to Open Power Query / Query Editor
Extracting the Data from Data Sources
Transforming the Data using GUI Options
Loading the Data in Power Pivot
Query Editor UI(Queries Pane, Data Pane / Results Pane, Power Query Ribbon)
Query Settings Pane, Applied Steps, Formula Bar, Advanced Editor
Understanding Power Query Conceptually
Data types and Filters in Power Query
Data types and Filters in Power Query
Data types, Changing the Data type of a Column, Detect Data Type
Filters in Power Query and their Purpose
Types of Filters in Power Query(Basic Filtering, Advanced Filtering)
Auto Filter / Basic Filtering
Filter a Column using Advanced Text Filters
Filter a Column using Advanced Number Filters
Filter a Column using Advanced Date Filters
Filter Multiple Columns
Inbuilt Column Transformations
Inbuilt Column Transformations
Remove Columns / Remove Other Columns
Choose Columns, Go To Column
Name or Rename a Column
Reorder Columns or Sort Columns(Move Left, Right, To Beginning, To End)
Column from Examples( From All Columns, From Selection)
Add Column / Custom Column
Duplicate Column, Split Column, Merge Columns
PIVOT, UNPIVOT Columns, Transpose Columns
Replace Values, Remove Empty
In built Row Transformations
In built Row Transformations
Header Row or Use First Row as Headers, Use Headers as First Row
Keep Top Rows, Keep Bottom Rows, Keep Range of Rows
Keep Duplicates, Keep Errors
Remove Top Rows, Remove Bottom Rows, Remove Alternative Rows
Remove Duplicates, Remove Blank Rows, Remove Errors
Group Rows / Group By
Merge Queries / Join Tables
Merge Queries / Join Tables
Merge Queries, Merge Queries as New
Need of Merge Queries
Minimum requirements to Perform Merge Queries
Types of Joins / Join Kinds / Merge Type
Left Outer (all from first, matching from second)
Right Outer (all from second, matching from first)
Full Outer (all rows from both)
Inner (only matching rows)
Left Anti (rows only in first)
Right Anti (rows only in second)
Cartesian Join or Cross Join, Self-Join
How to Merge 3 Tables
Use Fuzzy Matching Option
Append Queries / Union ALL Tables
Append Queries / Union ALL Tables
Append Queries, Append Queries as New
Minimum requirements to perform Append Queries
Append Two Tables , Append Three or More Tables
Folder as Source
Appending Multiple Files of same type from a folder using Single Query
Appending Multiple Excel Files and Multiple Sheets using Single Query
Union All, How to get Union Result
Query Options
Query Options
Copy Query, Paste Query, Delete Query, Rename Query
Enable Load, Include in report Refresh
Duplicate Query, Reference Query
Move to Group, Move Up, Move Down
Create Function, Convert To Parameter
Advanced Editor, Properties
Home Tab Options
Home Tab Options
Close & Apply, Apply, Close
New Source, Recent Sources, Enter Data, Data Source Settings
Manage Parameters( Manage Parameters, Edit Parameters, New Parameter)
Suggested Values(Any Value, List of Values, Query)
Convert to List
Refresh Preview, Refresh All, Cancel Refresh
Sorting Data
Transform Tab Options
Transform Tab Options
Reverse Rows, Count Rows, Replace Values, Replace Errors, Fill Down, Fill Up
Text Column, Number Column, Date & Time Column Options
Structured Column(Expand, Aggregate, Extract Values)
Run R Script, Run Python Script
Add Column Tab Options
Add Column Tab Options
Create Custom Function, Invoke Custom Function
Conditional Column, Index Column, Duplicate Column
From Text, From Number, From Date & Time Column Options
View Tab, Tools Tab & Help Tab Options
View Tab, Tools Tab & Help Tab Options
Power Pivot
Power Pivot Software Overview
Power Pivot Software Overview
Understanding about Power Pivot – A In Memory Columnar Database
Advantage of In Memory Columnar Database
Power Pivot – xVelocity In-memory Analytics Engine (Previously called Vertipaq)
Overview of Data Modeling – Model View(Previously Relationship View)
Enhancing the Data Model – DAX(Data Analysis eXpressions) Language – Data
View
Power BI Data Modelling – Model View (Previously Relationship View)
Power BI Data Modelling – Model View (Previously Relationship View)
Data Modeling Introduction
Relationships, Need of Relationship Between Tables
Dimension Column, Fact Column
Dimension Table, Fact Table
Star Schema, Snowflake Schema
Galaxy Schema or Hybrid Schema or Fact Constellation Schema
Relationship Types / Cardinality in General
One-to-One, One-to-Many (or Many-to-One), Many-to-Many
AutoDetect the relationship, Create a new relationship
Edit existing relationships, Delete a relationship
Make Relationship Active or Inactive
Cross filter direction (Single, Both), Apply Security Filter in Both Directions
Assume Referential Integrity
Enhancing the Data Model - DAX
Enhancing the Data Model – DAX
What is DAX(Data Analysis eXpressions) Language – Functional Language
New Column, New Measure / Quick Measure, New Table
DAX Table and Column Name Syntax
Creating New Column, Creating New Measure
Implicit Measures, Explicit Measures
Difference Between New Columns & New Measures
DAX Operators, Types of Operators
Arithmetic Operators, Comparison Operators
Text Concatenation Operator, Logical Operators
DAX Functions - Categories
DAX Functions – Categories
Text Functions
Logical Functions
Date and Time Functions
Filter Functions
Math & Statistical Functions
Time Intelligence Functions
DAX Date & Time Functions
DAX Date & Time Functions
YEAR, MONTH, DAY
WEEKDAY, WEEKNUM
FORMAT (Text Function) Month Name, Weekday Name
DATE, TODAY, NOW
HOUR, MINUTE, SECOND, TIME
DATEDIFF, CALENDAR
Creating Date Dimension Table
DAX Text Functions
DAX Text Functions
LEN, CONCATENATE (&)
LEFT, RIGHT, MID
UPPER, LOWER
TRIM, SUBSTITUTE, BLANK
DAX Logical Functions
DAX Logical Functions
IF
TRUE, FALSE
NOT, OR, IN, AND
IFERROR
SWITCH
DAX Math and Statistical Functions
DAX Math and Statistical Functions
INT
ROUND, ROUNDUP, ROUNDDOWN
DIVIDE
EVEN, ODD
POWER, SIGN
SQRT, FACT
SUM, SUMX
MIN, MINX
MAX, MAXX
COUNT, COUNTX
AVERAGE, AVERAGEX
COUNTROWS, COUNTBLANK
DAX Filter Functions
DAX Filter Functions
CALCULATE
ALL
RELATED
DAX Time Intelligence Functions
DAX Time Intelligence Functions
Time Intelligence Introduction
TOTALMTD, TOTALQTD, TOTALYTD
PREVIOUSDAY, PREVIOUSMONTH, PREVIOUSQUARTER, PREVIOUSYEAR
NEXTDAY, NEXTMONTH, NEXTQUARTER, NEXTYEAR
SAMEPERIODLASTYEAR
YOY Growth, QOQ Growth, MOM Growth
Power View
Report View / Power View
Report View / Power View
Report View User Interface
Fields Pane, Visualizations pane, Ribbon, Views, Pages Tab, Canvas
Visual Interactions
Interaction Type (Filter, Highlight, None)
Visual Interactions Default Behavior, Changing the Interaction
Filters in Power View
Filters in Power View
Filter Types
Visual Level Filters, Page Level Filters, Report Level Filters, Drill Through
Filters
Filter Sub Types
Basic Filtering, Advanced Filtering, Top N, Relative Date Filtering
Numeric field filters, Text field filters, Date and Time field Filters
Grouping, Binning & Sorting
Grouping, Binning & Sorting
Grouping and Binning Introduction
Using grouping, Creating Groups on Text Columns
Using binning, Creating Bins on Number Column and Date Columns
Sorting Data in Visuals
Changing the Sort Column, Changing the Sort Order
Sort using column that is not used in the Visualization
Sort using the Sort by Column button
Hierarchies and Drill-Down Reports
Hierarchies and Drill-Down Reports
Hierarchy Introduction, Default Date Hierarchy
Creating Hierarchy, Creating Custom Date Hierarchy
Change Hierarchy Levels
Drill-Up and Drill-Down Reports
Data Actions, Drill Down, Drill Up, Show Next Level, Expand Next Level
Drilling filters other visuals option
Power BI Visualizations
Power BI Visualizations
Visualizing Data, Why Visualizations
Visualization types, Field Wells
Visuals for Filtering, Visualizing Categorical Data, Visualizing Trend Data
Visualizing KPI Data, Visualizing Tabular Data, Visualizing Geographical Data
Leveraging Power BI Custom Visuals
Visuals for Filtering
Visuals for Filtering
Slicer Visualization
When to use a Slicer
Create and format Slicer Visualization
Hierarchy Slicer (Custom Visualization)
When to use a Hierarchy Slicer
Create and format Hierarchy Slicer
Advantages of Hierarchy Slicer
Visualizing Categorical Data
Visualizing Categorical Data
Create and Format Bar and Column Charts
Create and Format Stacked Bar Chart Stacked Column Chart
Create and Format Clustered Bar Chart, Clustered Column Chart
Create and Format 100% Stacked Bar Chart, 100% Stacked Column Chart
Create and Format Pie and Donut Charts
Create and Format the Tree Map Visual
Create and Format Scatter Charts
Visualizing Trend Data
Visualizing Trend Data
Line and Area Charts
Create and Format Line Chart, Area Chart, Stacked Area Chart
Combo Charts
Create and Format Line and Stacked Column Chart, Line and Clustered Column
Chart
Create and Format Ribbon Chart, Waterfall Chart, Funnel Chart
Visualizing KPI Data
Visualizing KPI Data
Create and Format Gauge Visual, KPI Visual
Create and Format Card Visualization, Multi Row Card
Visualizing Tabular Data, Geographical Data & R Script Visual
Visualizing Tabular Data, Geographical Data & R Script Visual
Create and Format Table Visual, Matrix Visualization
Create and Format Map Visual, Filled Map Visual, Arc GIS Maps Visual
Create and Format R Script Visual
Why should I learn Microsoft Power BI from IQ Stream Technologies?
Why should I learn Microsoft Power BI from IQ Stream Technologies?
Our Microsoft Power BI training program can be customized to suit everyone’s needs. We have a
team of great professionals with ample experience in international industry, well-versed with all
the latest advancements in modern technology and tools. We also provide our trainees with
Microsoft power bi tutorials in the form of videos, PDFs, questionnaires, etc., along with interview
assistance.
Can I expect a job right after completing the course?
Can I expect a job right after completing the course?
All our courses are 100% job-oriented. If you’re sincere enough during the course, we’ll go extra-
mile to get you the dream job.
We’ll provide you with interview materials, mock interviews, general interview routine, commonly
asked questions and a lot more. Our expert faculty members will also counsel you and help you
prepare an effective resume for a great first impression. We’ll also help you get familiar with the
market, and the history, ideologies and work culture of all the companies you’re interested to
work with and also the ones we refer you to.
What if I miss a class?
What if I miss a class?
IQ Stream Technologies have many types of classes you can choose from as per your own
convenience. You can go with regular classes, online sessions or corporate training depending on
your schedule.
Even If you miss a class, you can always access the recorded session 24/7 or re-attend the class if
you want.
What is the Microsoft power bi cost at IQ Stream?
What is the Microsoft power bi cost at IQ Stream?
IQ Stream Technologies is not just known for offering the best training and learning sessions of
which Microsoft Power Bi tutorial is one. Still, our training course fees are very competitive in the
town. For more info on fee and structure, kindly give us a call or send us a mail.
Konanki Manimala
-
- 4.7


Iq stream providing best soft skill class.it was very useful for fresher and who are not able to communicate in front of others.i was thankfull to Sidharth for training me and given confidence that I can speak in English.
Ganesh Nandkhile
-
- 4.7


Geetha KLR
-
- 4.7


I had taken Oracle SOA training from Mr. Bhaskar. He is highly experienced and helped us with real time scenarios. The training was very effective. Thanks Mr. Bhaskar for all your support during the training.
Training


Related Courses
DotNet (.Net)

ASP.NET
SQL SERVER

SHARE POINT
WPF
WINDOWS FORM
WCF

WEB API

Microsoft Azure

Microsoft Power BI
Microsoft Dynamics CRM

Microsoft Azure Administrator Associate

Microsoft Azure Developer Associate

Microsoft Azure DevOps Engineer Expert


